Phisaver provides lots of high quality data, and is easily accessed visually and programmatically. This is of interest to academics, students and schools.
Energy Consumption Research
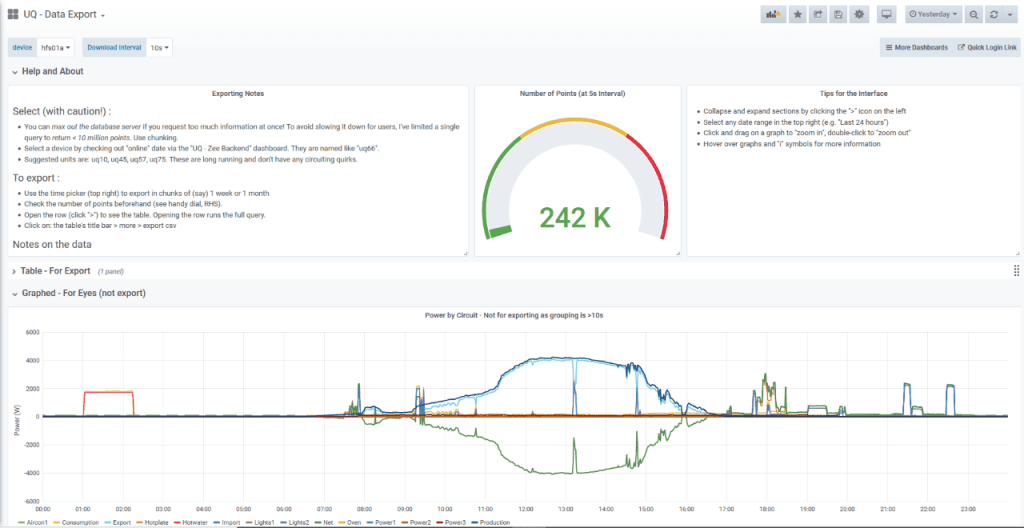
Short interval for each circuit is available instantaneously and via a database. This includes
- 5 second interval, with data integrated over this period
- power (W), power factor, voltage (V)
- reactive and real power (VA, W)
- easy to download (csv) and well labelled
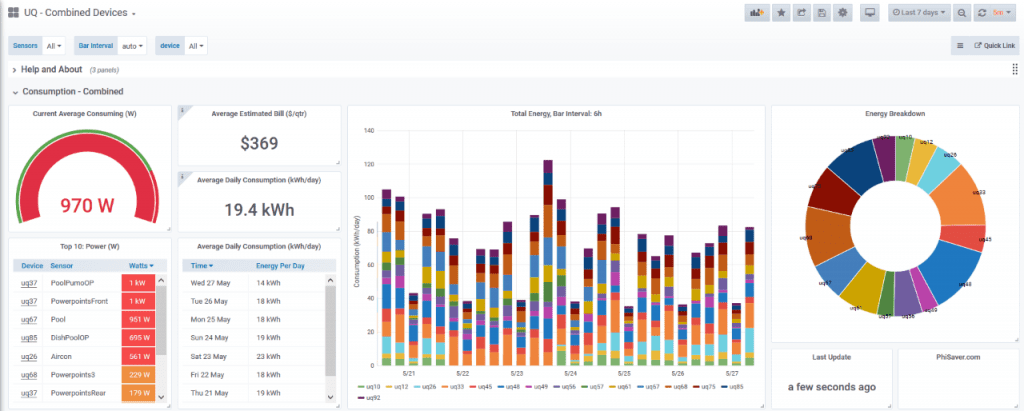
Case Study: UQ Centre for Data Innovation
Led by Dr Stephen Steve, this study used dozens of PhiSavers to collect data, and a dedicated cloud storage system to provide access to research.

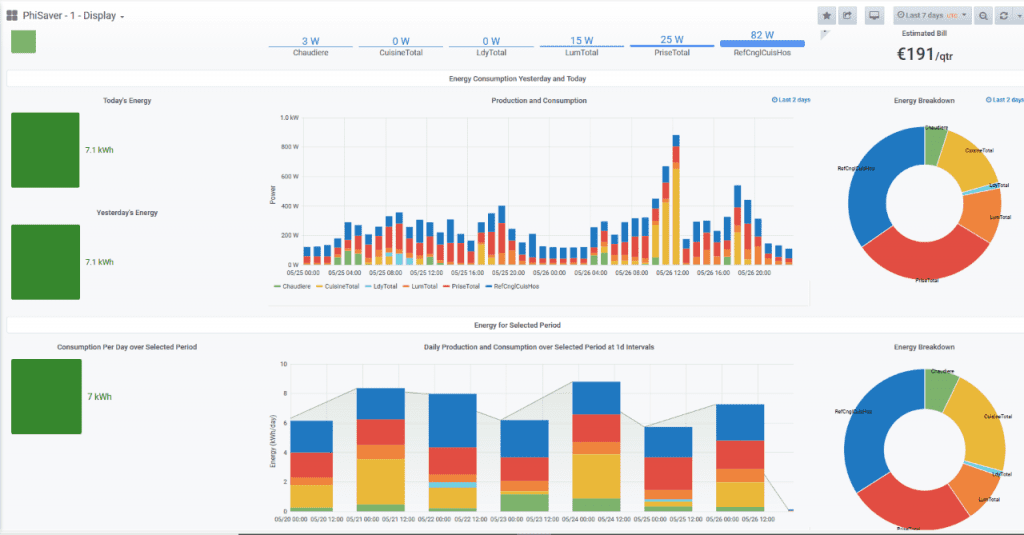
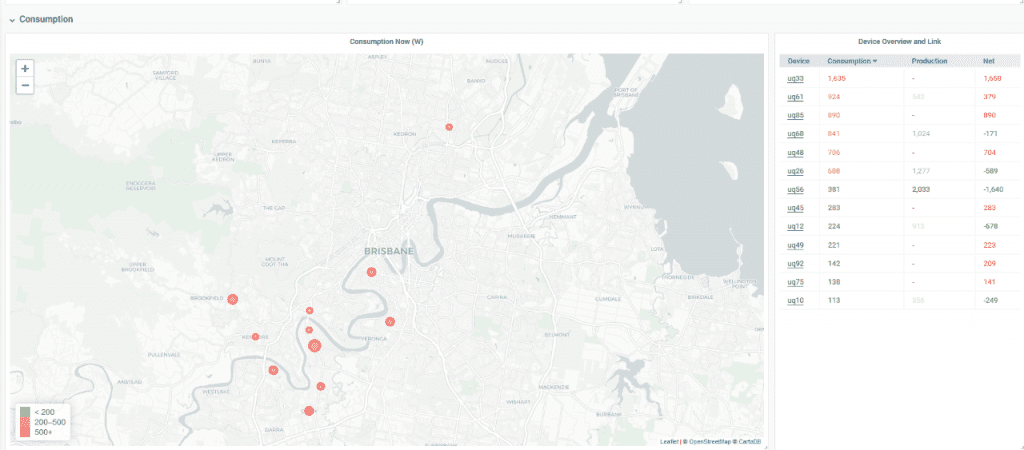
Multi-Site Aggregation Visual Export Interface Single User Interface Live Map of Sites
Energy Quality Research
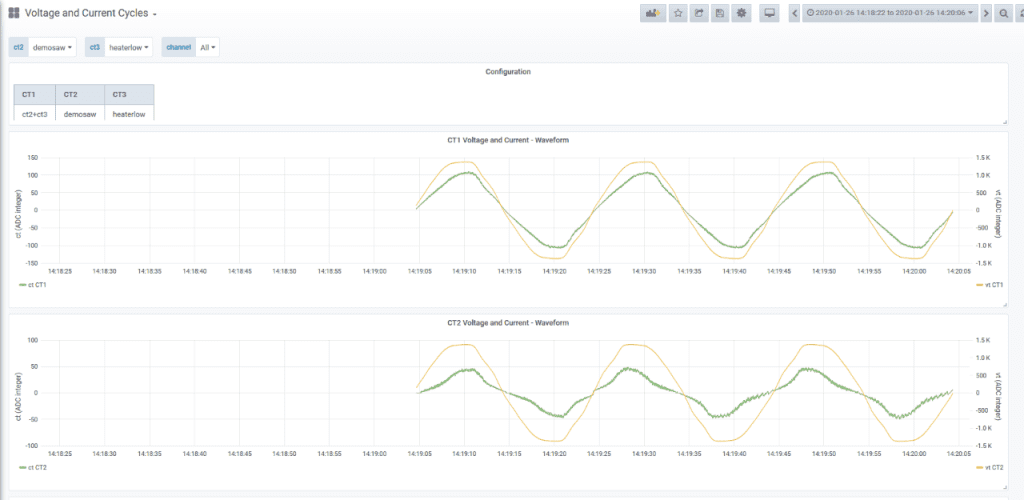
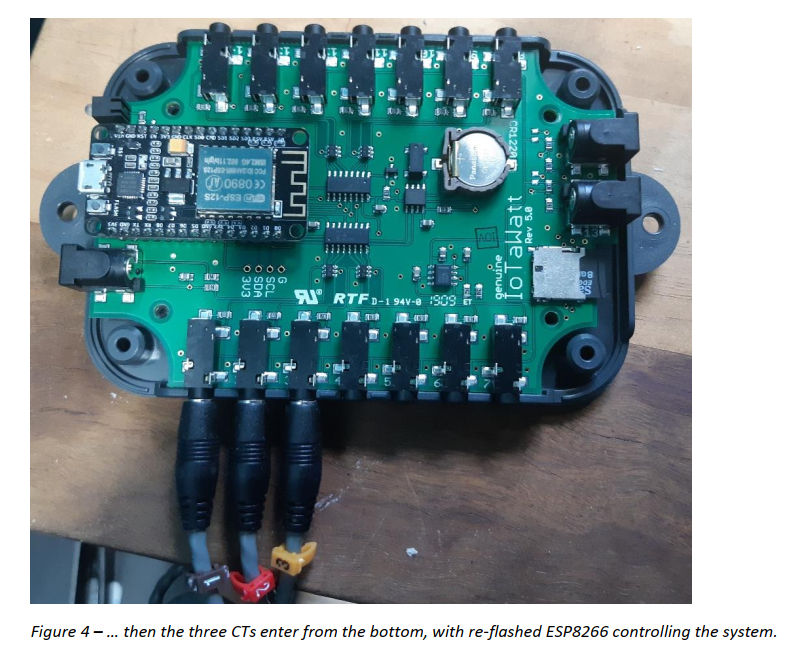
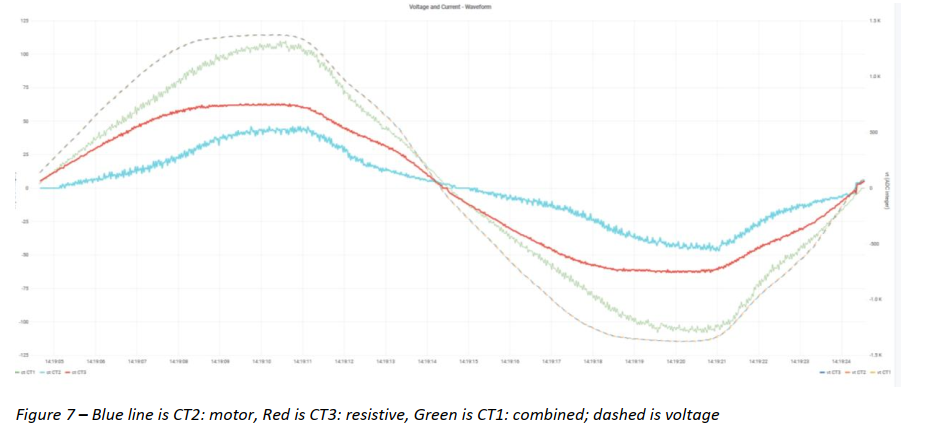
The hardware behind PhiSaver, IotaWatt, has open-source software. We can modify the firmware to read voltage and current very rapidly to capture the voltage and current waveform. Around 100 samples per waveform is possible, giving good ‘shape’ resolution.
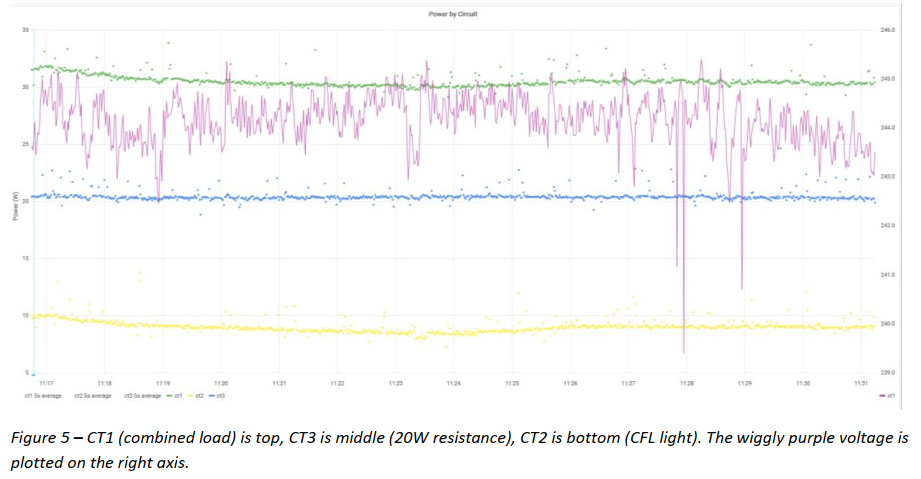
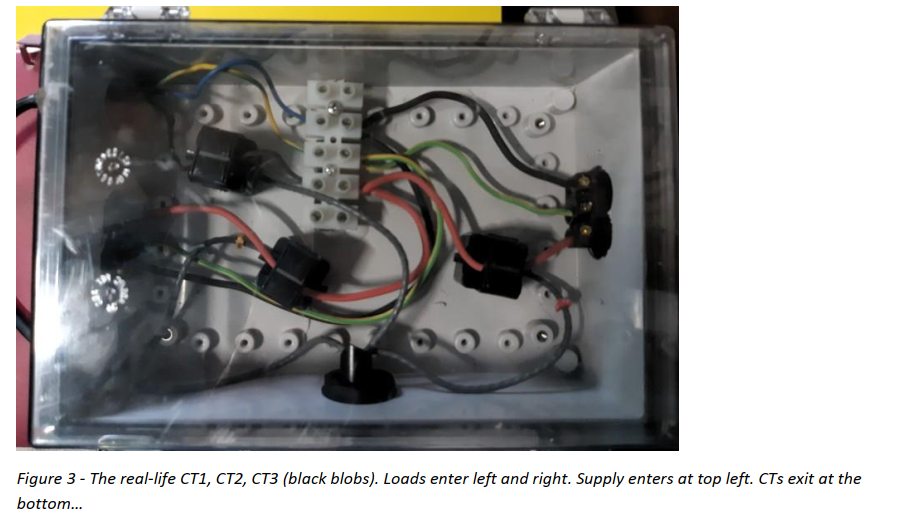
Case Study: Circuit Differentiation with Waveforms
A key application is research into differentiating multiple loads of one circuit. Some snapshots of the latest research using PhiSaver are below:
Voltage and Current Data Download Interfaced Combined Current with Noise New Firmware for the Esp32 for HFS Test Setup for Waveform Sample Waveform Results
Unexplored Research Opportunities
There’s lot of scope to use PhiSaver for research. The following ideas are only on the drawing board for the moment:
- Sleep patterns via energy consumption times
- Air-conditioning and resource usage via energy consumption: correlation to age / suburb / temperature. Real efficiency of air-condtitioning.
- Students using database of energy measurements to experiment with new interface effectiveness.
- Education via live-streamed energy consumption data: students predict outcomes, calculate and check against real data.
- Education via waveform: demonstrate what the power factor is instead of explain it: plug in various appliances (resistive, inductive) and see live stream of the waveform.
Data Availability
Some technical details on the data available from your PhiSaver install:
- Phisaver stores lots of data using a time-series database.
- Data points are timestamped to millisecond resolution and labelled by circuit
- Typically power (W) and voltage (V) are recorded but power factor (phi) and all derived data is available (real, imaginary power, etc).
- A web interface allows users to select units / time periods / etc visually, then download via CSV. Other formats available (JSON, db, binary, etc). See screenshots above.
- Programmatic access is available via URL endpoints. There are easy-to-use clients for Python, C, etc.
- The interface can be customised to any purpose, and embedded in other websites.